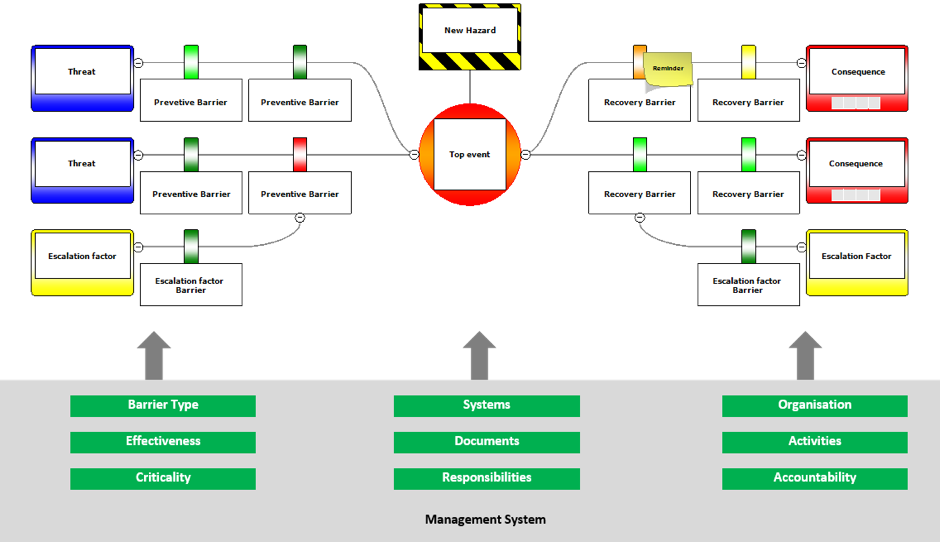
Bow tie methodology
A bowtie enables you to visualise the risks you are dealing with in just one, easy to understand picture. This is the simplest methodology to effectively communicate Hazards, Threats, Consequences and Controls in any process to cope up with today’s dynamic business environment.
The methodology takes is parentage from the Fault Tree Analysis and the Event Tree Analysis blended with Reasons’s Swiss cheese model. The resulting diagram is shaped like a bow-tie, creating a clear differentiation between proactive and reactive risk management. The power of a BowTie is that it shows you a summary of scenarios in a single picture. In short, it provides a simple, visual explanation of risk that would be much more difficult to explain otherwise.
The bowtie methodology is used in various industry sectors
Chemicals • Process • Aviation • Oil & Gas – Offshore / Onshore • Manufacturing • Steel • Construction • Infrastructure • Project Management • Information Technology • Telecommunications • Environment • Power • Health / Hospitals • Logistics • Farming • Water Transport • Rail Transport •Road Transport • Shipping/Maritime • Aviation • Regulatory bodies • Finance • Education • Airports • Defence – Army /Navy / Airforce
The bowtie diagram consists of the following 8 building blocks or stages of evaluation.
Characteristics of activities we perform
Outcome when the control on hazard is lost
Factor attributable to the loss of control on hazard.
Resulting effect of the top event.
Arrangement to prevent the loss of control on hazard
Measures to minimize the effect of consequences.
Factors that may fail the control
Process implemented to prevent the failure of control
The Final bowtie diagram.


